
Linux System Monitoring: Tools and Techniques
Linux is the backbone of countless servers, containers, and embedded systems across the globe. Understanding how to monitor these systems effectively is crucial for maintaining stability, identifying performance bottlenecks, and troubleshooting issues before they escalate. In this article, we’ll delve into the world of Linux system monitoring, exploring essential tools and the strategies seasoned Linux gurus employ.
Core Areas of Monitoring
Let’s break down the key areas you need to focus on when monitoring your Linux systems:
- CPU Utilization: The heart of your system. Monitoring CPU usage helps you understand if your system has enough processing power, detect processes hogging resources, and identify potential hardware bottlenecks.
- Memory (RAM) Usage: The workspace of your system. Keeping an eye on memory usage reveals if there’s enough RAM for your applications, lets you spot memory leaks, and aids in determining if memory upgrades are necessary.
- Disk I/O: Monitoring disk input/output (I/O) activity is essential for identifying performance issues within storage systems, tracking disk usage patterns, and predicting future disk space needs.
- Network Traffic: The lifeline of connected systems. Network monitoring allows you to analyze bandwidth usage, pinpoint traffic anomalies that could signal issues, and troubleshoot network connectivity problems.
- Processes: The running programs on your system. Process monitoring helps you understand the behavior of individual processes, spot runaway or resource-hungry applications, and terminate misbehaving processes.
Essential Linux Monitoring Tools
Linux offers a rich set of built-in tools and specialized monitoring software. Here’s a selection of the most popular ones:
Built-in Commands
- top/htop: The classic tools for real-time system monitoring. These show a dynamic list of running processes, sorted by CPU or memory usage, providing a quick overview of your system’s workload.
- vmstat: Provides a snapshot of virtual memory statistics, CPU activity, and I/O operations.
- iostat: Reports detailed statistics on disk input/output activity.
- netstat: A versatile tool for displaying network connections, routing tables, interface statistics, and more.
- df: Displays information about disk space usage on mounted file systems.
- du: Estimates file space usage, helping track down large files or directories.
Specialized Monitoring Software
- Nagios: A powerful and industry-standard open-source monitoring solution. Offers comprehensive monitoring of servers, applications, and network devices with flexible alerting capabilities.
- Zabbix: Another popular open-source monitoring platform, known for its scalability, rich visualization options, and support for a wide range of devices and protocols.
- Prometheus: An open-source monitoring system with a focus on metrics collection and powerful querying capabilities. Often used in containerized and cloud environments.
- Grafana: A leading open-source platform for data visualization and analytics. Pairs beautifully with tools like Prometheus to create informative dashboards.
Guru Strategies: Beyond the Basics
Let’s move into more advanced territory where seasoned Linux administrators excel:
- Proactive Alerting: Don’t wait for systems to fail. Set up alerts based on thresholds for crucial metrics (e.g., high CPU usage, low disk space, unresponsive services) using tools like Nagios or Zabbix.
- Historical Data and Trending: Analyzing historical resource usage patterns can be invaluable for capacity planning, detecting gradual performance degradation, and establishing baselines for normal system behavior.
- Centralized Logging: Collect logs from multiple systems into a centralized location using solutions like the ELK stack (Elasticsearch, Logstash, Kibana) or Graylog. This makes troubleshooting easier by allowing you to correlate events across your infrastructure.
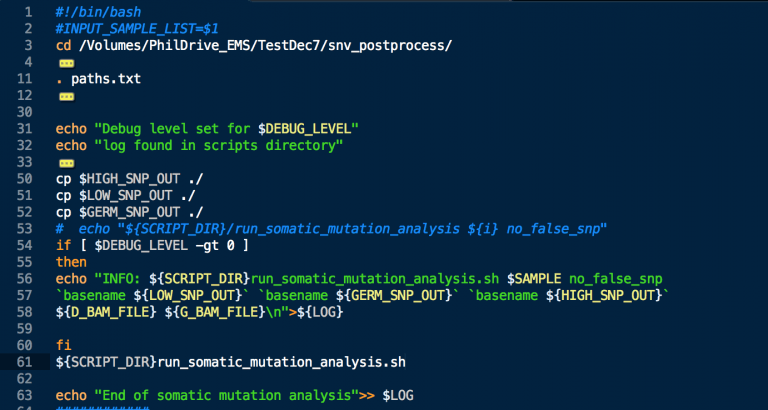
- Custom Scripting: The power of the Linux shell is unparalleled. Write custom scripts to automate monitoring tasks, extract specific data points, and integrate monitoring with other systems or tools.
- Security Monitoring: Don’t forget about security! Monitor log files for suspicious activity (e.g., failed login attempts), use file integrity monitoring tools