
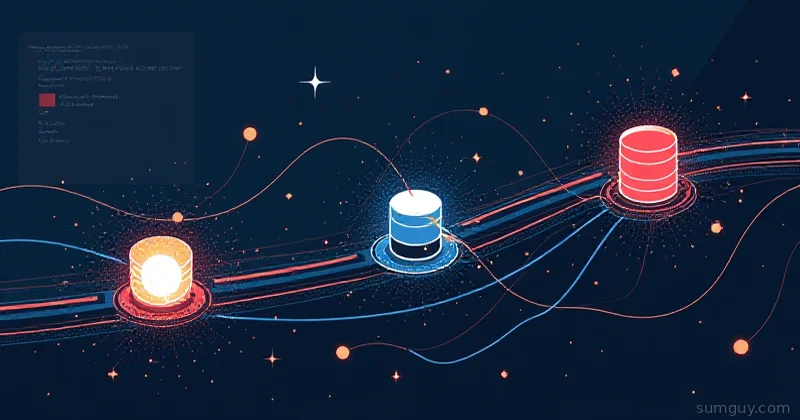
TIG: Telegraf + InfluxDB + Grafana
When Prometheus is overkill: a push-based metrics stack for IoT, smart home, and homelab data. Telegraf, InfluxDB, and Grafana, working together end-to-end.
All the articles with the tag "monitoring".
When Prometheus is overkill: a push-based metrics stack for IoT, smart home, and homelab data. Telegraf, InfluxDB, and Grafana, working together end-to-end.

Two OpenTelemetry-first observability platforms backed by ClickHouse. Here's how SigNoz and Uptrace compare for self-hosted homelab and small-team use.
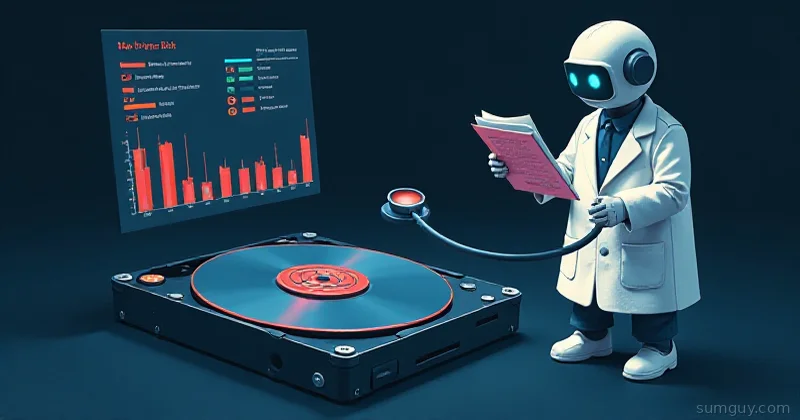
Disks fail. SMART tells you when. Here's how smartctl and smartd actually predict failure, and the attributes that matter (most don't).

ntopng vs darkstat: full DPI flow analysis vs a tiny always-on stats page. Pick the right tool for home-lab network visibility without losing your mind.

Promtail is deprecated. Here's how to migrate your scrape configs, pipeline stages, and Docker log setups to Grafana Alloy without losing your mind or data.
LibreNMS auto-discovers your switches, APs, and UPS over SNMP with zero MIB hunting. Here's how to deploy it and stop abusing Prometheus for this job.

SmokePing turns your ISP no-issue-detected excuse into a documented lie. Set it up in Docker and get clear visual proof of latency spikes and packet loss.

Riemann processes events as streams, not time-series. Here is why that distinction matters and when Clojure-based stream alerting still beats Prometheus rules.
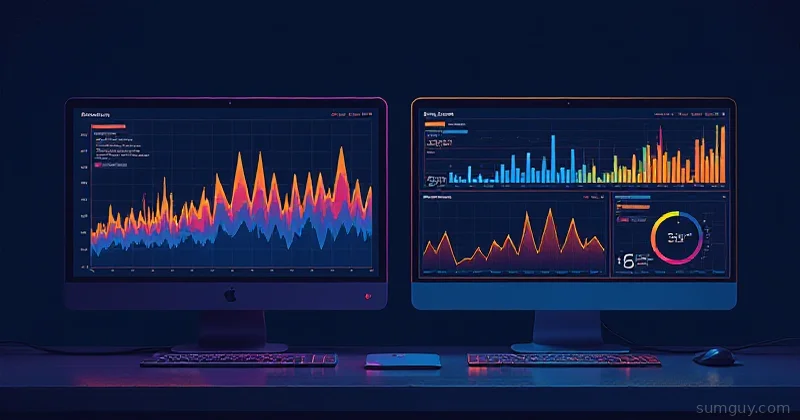
Glances vs Netdata: which free monitor wins for your home lab? We compare install effort, UI quality, alerting, and when to ditch both for Prometheus.
Run Sentry on your own hardware to catch real application errors, stack traces, source maps, release tracking, alerts, and when you should just pay for SaaS.

Heimdall, Homepage, or Homer? Pick the right self-hosted dashboard for your homelab, real configs, Docker auto-discovery, and live API status widgets included.

Stop guessing which container is eating your RAM. Set up cAdvisor + Prometheus to get real per-container CPU, memory, and network metrics in your homelab.