You Don’t Have an SRE Team. You Still Need an Error Budget.
Your home lab runs on one person’s spare time. That person is you. You don’t have an incident commander, a postmortem process, or a blameless culture, you have a server that went down at midnight and a question: “Can I sleep, or do I fix it now?”
Google’s SRE handbook talks about SLOs and error budgets like you’re running production infrastructure with a 24/7 on-call rotation. That’s not your life. But the concept of spending your reliability budget intentionally, instead of burning it on surprise failures, is exactly what separates a home lab that feels reliable from one that feels like you’re constantly putting out fires.
Let me translate SRE for one person.
What’s an SLI? What’s an SLO? What’s an SLA (and Why You Don’t Have One)?
SLI = Service Level Indicator. A metric you actually measure. Uptime. Response time. Success rate. Freshness (for *arr apps that scan libraries). You pick one, or a few, that matter to you and your use cases.
SLO = Service Level Objective. The target you commit to. “Nextcloud is available 99.5% of the time.” “Jellyfin responds in under 500ms 95% of the time.” Your SLO is the line between “this is fine” and “something’s broken.”
SLA = Service Level Agreement. A legal contract with penalties if you miss it. You don’t have this at home. There’s no customer to sue. Ignore it for now.
The dirty secret: almost every home lab operator has an implicit SLI and SLO in their head, they just don’t articulate it. You probably think something like: “Plex should basically always work” or “My backup can go down for a weekend.” That fuzzy feeling is worth making explicit, because the moment you know what you’re targeting, you can actually plan around it instead of just reacting.
The Math That Doesn’t Matter (But Is Kinda Fun)
Three nines, 99.9%, sounds solid, right? It means 99.9% uptime. Here’s the real number: that’s 8 hours and 46 minutes of downtime per year.
In a month? About 43 minutes.
In a week? About 10 minutes.
Your home lab is down for about 10 minutes a week on average if you’re aiming for three nines.
Four nines, 99.99%, is 52 minutes per year. Your ISP probably has a clause in their ToS that’s less strict than four nines.
Two nines, 99%, is about 3.65 days down per year (roughly 7.2 hours per month). That’s a long weekend you didn’t plan for.
For home lab use, two-and-a-half nines to three nines is the target range. Some services (Nextcloud, Jellyfin, *arr) want to be “always up.” Some (your backup job, internal monitoring) can tolerate a weekend outage. Pick accordingly.
Your Error Budget Is a Planning Tool, Not a Scorecard
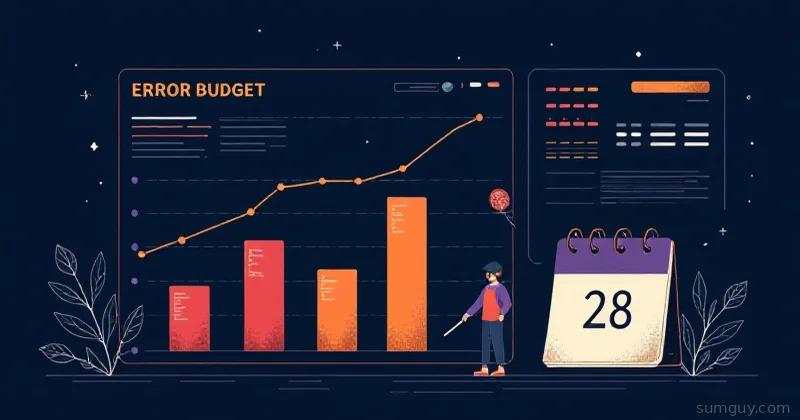
If you commit to 99% uptime (two nines), you have roughly 7.2 hours of downtime per month to spend. That’s your error budget. Once you’ve spent it (once you’ve had 7.2 hours of failures, planned or unplanned), you’re out.
Now, hypothetically: you want to do a risky upgrade. Migrate Postgres from one box to another. Swap out networking gear. You know it’s gonna cause 20 minutes of downtime.
With your error budget visible, you ask: “Do I have 20 minutes left this month?” If yes: you have permission to do the thing. If no: you either skip it, delay it to next month, or you increase your SLO target (accept less availability) to justify the work.
This is the magic. You’re not pulling maintenance out of thin air; you’re making a conscious trade: “I’m burning my budget on this upgrade instead of leaving it as a cushion for unexpected failures.”
Most home labs run blind. You just… do the upgrade. Sometimes it lands fine. Sometimes it cascades into a nightmare at 11 PM. With an SLO, you’re deciding in advance: am I comfortable doing this right now?
What Actually Matters to Measure?
You could measure a hundred things. Pick the ones that hurt when they break.
Availability. Is the service up or down? This is the obvious one. For critical services (Nextcloud, Plex), aim for three nines. For nice-to-have stuff, two nines is fine.
Latency. How fast does it respond? Jellyfin at 2-second load time is degraded even if it’s technically “up.” Measure the 95th percentile, the tail, because your users live in the tail. If it’s sluggy 5% of the time, they’ll notice.
Success rate. Did the request actually work? A 500 error is different from no response. A Plex transcode failure is different from a network timeout. Track what percentage of requests succeed and complete.
Freshness. For background jobs (backups, *arr scans, Prometheus scrapes), how old is the data? A backup from last week is stale. A Lidarr library that hasn’t re-scanned in 30 days is probably missing new music. Set a window (“my backup job should run at least once per 7 days”) and alert when it doesn’t.
Pick one, or maybe two, per service. Availability is usually the baseline. Add latency for interactive stuff. Add freshness for background jobs. Don’t measure everything.
The 28-Day Rolling Window
When you commit to an SLO, over what time period?
Annual? “99% uptime per year” sounds huge until you realize you’re planning against one big outage or many small ones spread across 365 days. Annual feels slow.
Monthly? “99% uptime this calendar month” is better, but arbitrary. Why does your budget reset on the 1st? It creates cliff edges: “Oh no, it’s the 30th and I’m out of budget.”
Rolling window. Last 28 days, always. This month and most of last month. Budget resets a little bit every day as old failures scroll out the window. It’s smoother. You’re not climbing back from a January disaster in February; it’s already decaying.
28 days is the home lab standard. It’s four work weeks. It’s long enough that one bad night doesn’t wreck your month, but short enough that you feel the pressure if you’re sloppy.
Burn Rate Alerts (Or: “Something’s Eating My Budget”)
You’ve got your SLO: 99% uptime (2 nines). Your error budget is 7.2 hours per month, which is about 14 minutes per day.
Now: is your service burning that budget at a normal rate, or is something fast breaking it?
Slow burn. You’re having a mild flakiness problem. Random timeouts. Occasional failed requests. It’s eating your budget, but over a full 28-day window at this rate, you’d just… make your SLO.
Fast burn. Your database crashed. The service is in a degraded state or fully down. At this rate, you’d exhaust your entire monthly budget in hours.
Slow burn? You’ve got time. File a ticket. Fix it in your next maintenance window.
Fast burn? Drop everything. It’s an actual incident.
In Prometheus, this is simple:
(1 - avg_over_time(up{job="nextcloud"}[5m])) > 0.05This says: “If Nextcloud is down more than 5% of the time in the last 5 minutes, fire an alert.” That’s fast burn. At that rate, you’re chewing through your budget in hours. Wake up.
For slow burn, you’d alert if it happens over a longer window, say, 2 hours:
(1 - avg_over_time(up{job="nextcloud"}[2h])) > 0.01“If the failure rate over 2 hours is worse than 1%, something’s wrong, but not an emergency.”
One Grafana SLO Panel That Actually Works
You don’t need a fancy SLO platform. You need three things:
- A metric you’re measuring (SLI)
- A target (SLO)
- Time-series math
Grafana can do this with one PromQL query. Here’s the pattern:
100 * ( sum(increase(requests_total{job="nextcloud", status=~"2.."}[28d])) / sum(increase(requests_total{job="nextcloud"}[28d])))This says: “Over the last 28 days, what percentage of requests to Nextcloud succeeded (2xx status)?”
If it’s 99.5%, you’re above your 99% SLO. You have some buffer.
If it’s 98.9%, you’re below target. You’re already in the red for the month.
Display it as a gauge with a green zone (your SLO target) and a red zone (below SLO). Now you can see your error budget burning in real time.
Add a second query for the alert threshold (e.g., “If we drop below 99% at this rate, we won’t make 28 days”) and you’ve got a working SLO dashboard.
(If you don’t have a request counter, use up and boolean math. up is 1 if the service is reachable, 0 if not. Same query, different metric.)
The “Good Enough” Mindset
Here’s what I see a lot: home lab operators stress about 99.99% uptime and then accept a flaky $7-a-month VPS running their reverse proxy.
Stop. Decide what’s actually critical:
- Never should be down: Nextcloud (you’re using it daily), Plex (guests show up), your DNS (nothing works without it). Aim for three nines.
- Can handle a few hours: Backups, *arr apps, monitoring itself. Two nines is fine.
- Can handle a day: Experiments, lab services, one-off dashboards you built last week. 99% or even 95% is OK.
The effort to go from two nines to three nines is exponential. You need redundancy. Failover. Real monitoring. It’s a sunk cost that doesn’t make sense for a home lab unless you’re running a service for others (and honestly, even then, “it’s a hobby project” is fair game).
Good enough is good enough. Pick a realistic target, hit it reliably, and spend your energy on things that matter.
Anti-Pattern: The Lying Dashboard
I see a lot of “everything is green” dashboards that have never made a noise. They’re useless.
A good SLO dashboard tells you the truth: “We’re at 98.2% availability this month, down from the 99% target.” It hurts a little to see red. That’s the point. That red tells you something’s wrong and needs fixing.
If your dashboard is always green, either your SLOs are set too low (pointless), or you’re not measuring what actually matters (worse, you have no signal).
The dashboard should make you uncomfortable sometimes. That discomfort is data. Use it.
SLOs You Can Actually Defend
When someone (maybe just you, at 2 AM, trying to decide if you need to wake up and fix something) asks “Why did that service go down?” you need a good answer.
“I was out of error budget” is a valid answer. You knew you had limited uptime to spend, you spent it, and that’s a choice.
“Totally random, nobody knows why” is not a good answer. That’s what happens when you don’t have SLOs: chaos masquerading as normalcy.
Set a target. Measure against it. When you miss it, investigate. When you’re burning it fast, respond. When you’re under budget, you’ve earned the right to do a risky upgrade or let a low-priority service degrade for a while.
SLOs aren’t for impressing your boss (you don’t have one at home). They’re for telling the difference between “expected” and “broken,” and for letting you plan instead of just react.
And honestly? Having an explicit error budget, even if it’s just in Grafana, beats the alternative: that nagging feeling that your infrastructure is held together by hope and duct tape, and someday it’s all gonna fall apart at the worst possible time.
At least with an SLO, you’ll know it’s coming.